The Shelf Tells the Story: Using Reality Data and AI to Fix Execution Gaps

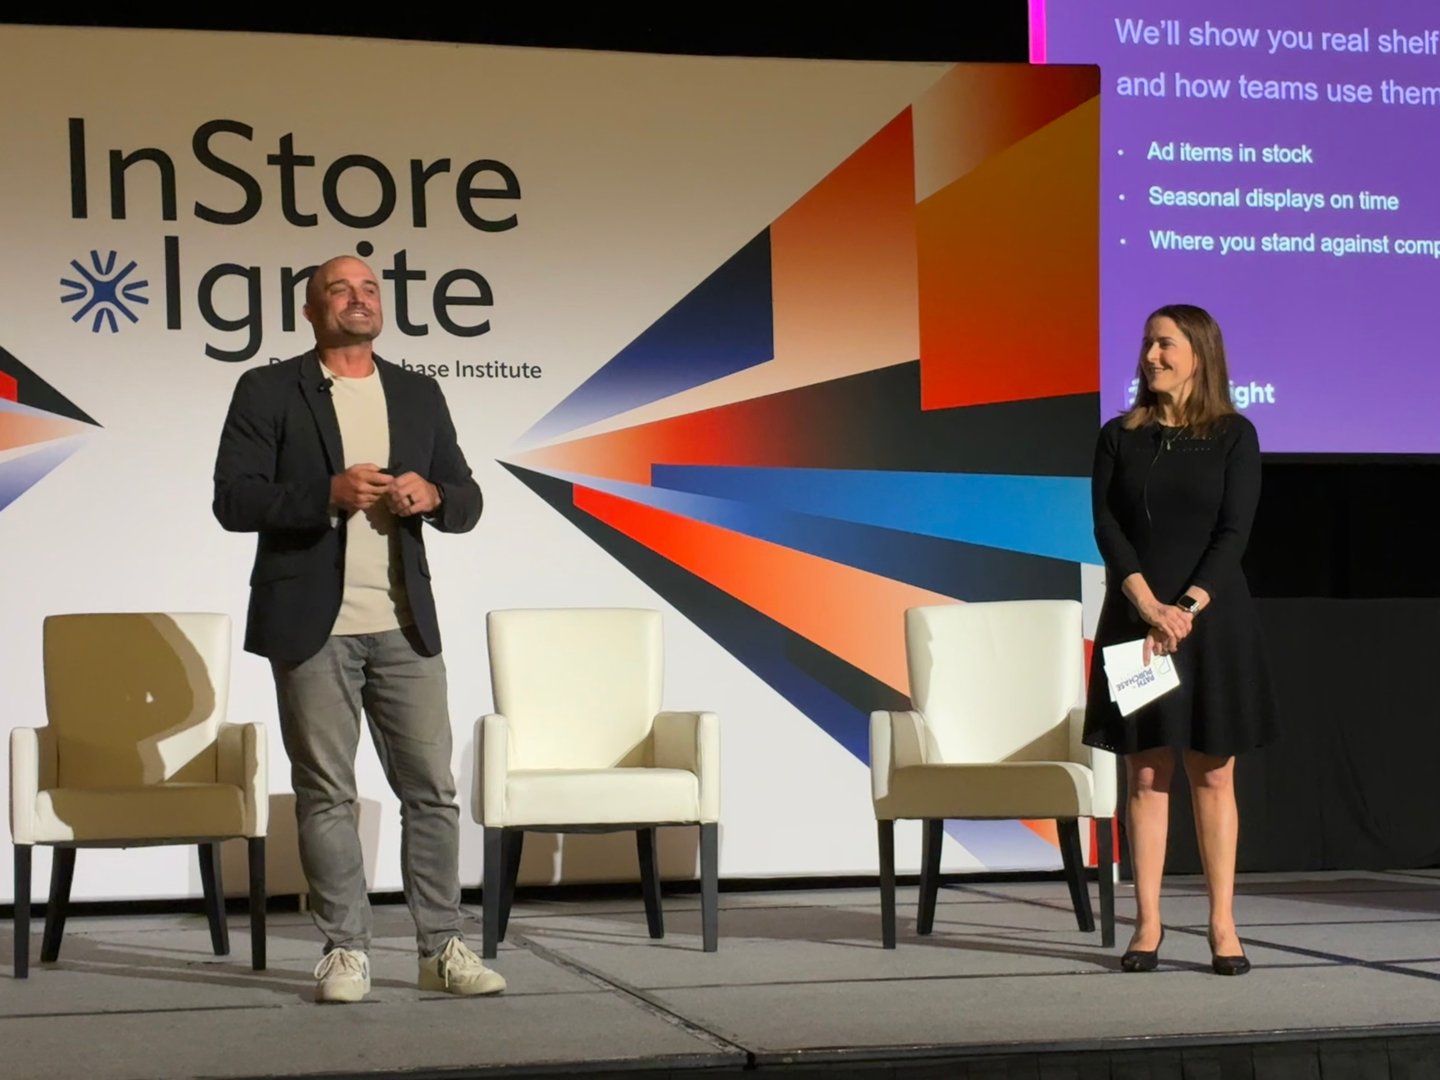
Retail reality data, captured through crowdsourced photos and AI-driven data extraction, can provide visibility into the physical shopping experience to explain the "why" behind sales performance. That was the message from Marc Yount, president and chief operating officer at Storesight, during a session at the Path to Purchase Institute's InStore Ignite event on Nov. 11 in Chicago.
While traditional shipment and point-of-sale data provide insights into how products are selling, they don’t necessarily account for the conditions that may be influencing those sales. Photographs collected across stores can offer another layer of context, enabling brands to examine factors such as product availability, shelf placement and merchandising execution alongside sales performance.
Advances in technology have made it possible to extract and aggregate data from large volumes of these images, Yount said, providing a more comprehensive view of “what’s actually happening at the shelf.”
This data helps brands understand if sales fluctuations are due to demand issues or execution failures like out-of-stocks or missing displays.
“Any of you who have dabbled with actually doing something with reality data at the shelf — what's actually in stock, what the shelf actually looks like, whether your display is actually up — can understand that it can help answer this why hypothesis a lot of times, where POS might tell you what happened." he said. "'We grew during that display period,' or 'we didn't.' But it's hard to say why you did or didn't grow until you get in front of the shelf and see what the shopper sees.”
A “Circular Deal Execution” study from Storesight showed that across 262 visits, 72% of store visits had every advertised item on the shelf, while 28% had at least one item out of stock. Of those locations with execution issues, 29% lacked even the correct promotional price tags.
What's more, half of these tagging errors occurred on either the first or last day of a promotion.
Yount also highlighted how seasonal shifts can be quantified using large-scale photo data. By tracking when a specific number of displays (e.g., 1,000 per week) appear, brands can identify "seasonal creep."
For example, data indicated that Halloween displays appeared in stores two weeks earlier than the previous year.
“It's what insights you can get to,” he said. “An example might be your competitor is always going out on promotion at times before you or after you. You're trying to figure those kind of things out, or you're trying to guide somebody through that process. And you've noticed over time that you can look at this type of data and actually understand what their cadence is. Maybe you can figure out a plan to get in store a little bit sooner than, or different times with differentiated messages than them.”
Yount addressed how brands can utilize these insights to drive growth and solve operational challenges. He suggested that store-level data is best used for building selling stories for buyers or fixing execution rather than directly informing upstream media spend.
He also offered three things for brands to check before locking in their 2027 plans:
- Check the store shelf during the ad. Were the ad items on the shelf all week? Look for the product itself along with the price and the sign.
- Watch the edges of every window: the first and last day of each ad, and the day seasonal displays actually land.
- Put shelf data next to POS. POS and shipments show what sold. The shelf shows what shoppers saw.