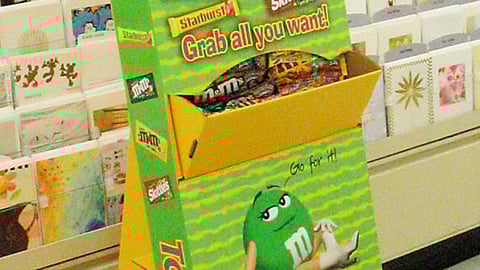
Cadbury Adams Gum Center
Client: Cadbury Adams USA, Parsippany, N.J.
Introduction: August 2003
Size of run: 5000
Materials/processes used: Corrugated, litho-mounted four-color process-printed header, casters
Producer: Rand Display International Inc., Teaneck, N.J.
Comments: A flexible header design allowed for customized promotions to be implemented at the retail level. The display was featured in store circulars to create awareness of cross promotions.