Infographic: The State of Ice Cream
Research from 84.51°, Kroger’s data analytics subsidiary, explores insights into how the frozen treat is faring among shoppers, from sales growth to shopping modality.

Recent research from Kroger’s data analytics subsidiary, 84.51°, explores the state of the ice cream category as 2024 marks the 40th anniversary of July being designated National Ice Cream Month.
An infographic shared with P2PI (see below) draws research from 84.51° Stratum, the company’s proprietary database of aggregated data sourced from more than 62 million households that shopped at Kroger in the latest 52 weeks, ending June 8. Additionally, 84.51°’s July Consumer Digest also dug into ice cream as well as other trends.
Some highlights on the state of the category from June and July include:
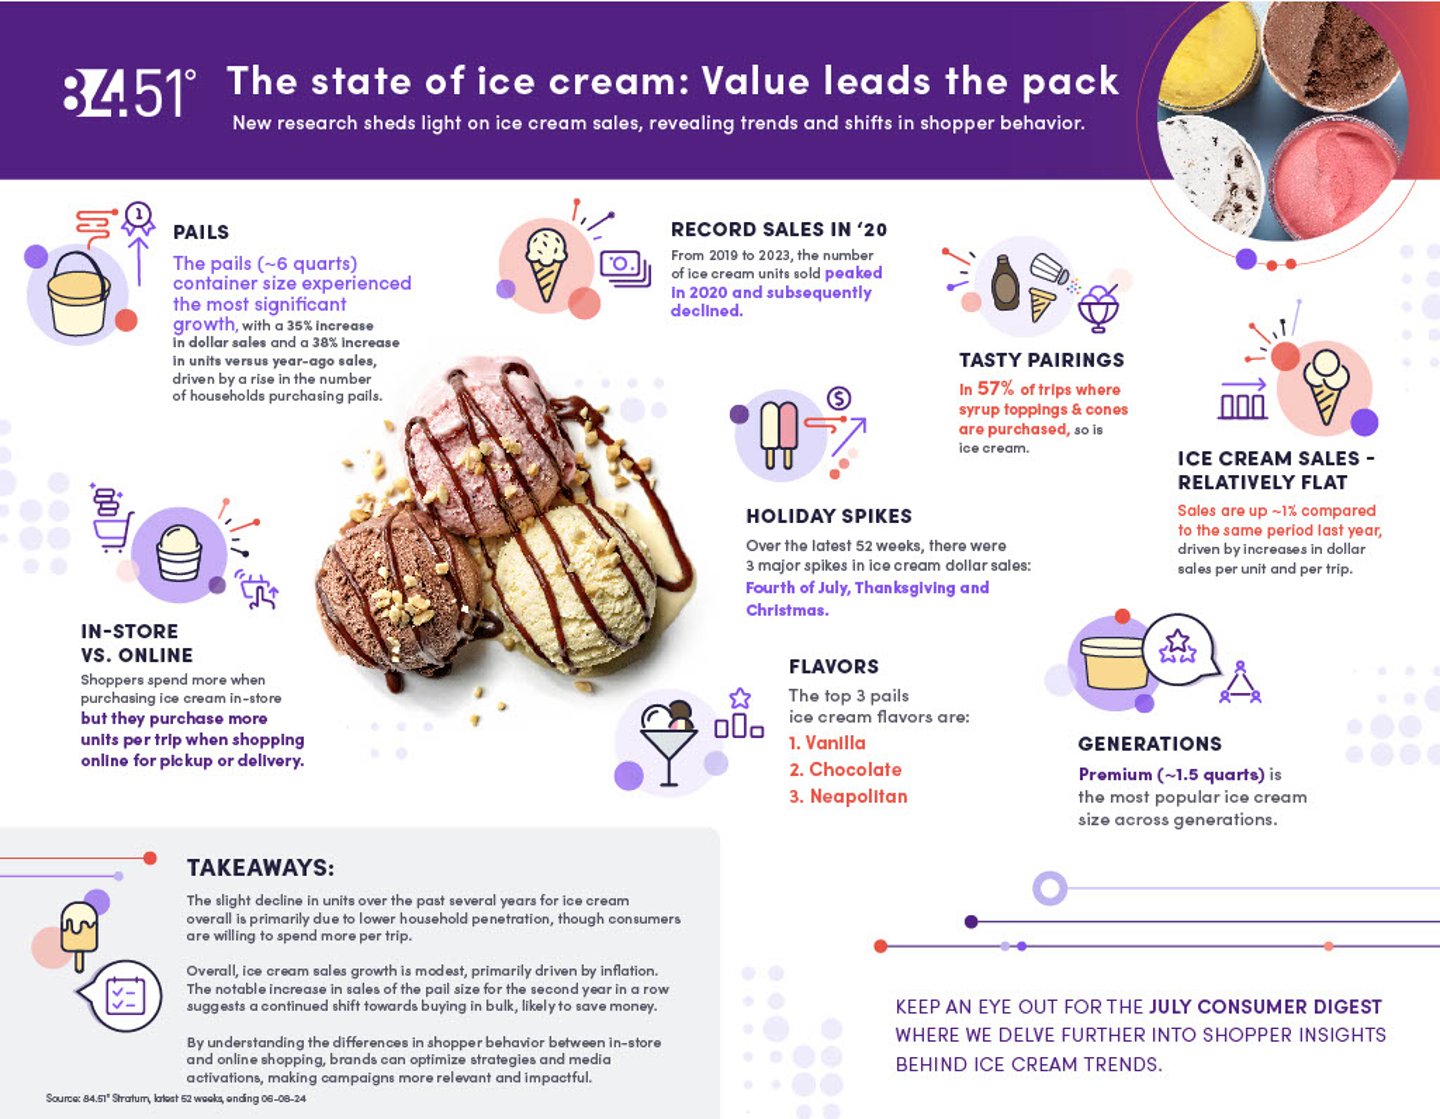
- Ice cream sales are flat compared to a year ago, up just 1%. Budget, value and the need to consume something healthier are consistent sentiments across the U.S.
- 53% of shoppers say they are eating the same amount of ice cream, while 30% of Millennials are consuming less and 19% of Gen X are consuming more compared to 2023.
- 24% of shoppers are buying more ice cream at grocery stores vs. 59% purchasing less from ice cream shops in 2024.
- They’re also shifting purchasing habits between private labels and national brands, with 18% of shoppers buying more private-label ice cream and 33% purchasing less of national brands.
- Shoppers spend more when purchasing ice cream in-store, but they purchase more units per trip when shopping online for pickup or delivery.
- Gelato (29%), frozen yogurt (28%) and sherbert (26%) top the list of the most popular non-traditional types of ice cream.
- Ice cream was purchased in 57% of trips where syrup, toppings and cones were purchased.
- Premium is the most popular type of ice cream across all generations.
- Compared to other container sizes, pails experienced the greatest increase in dollar sales. Dollar sales for pails (about 6 quarts) rose by 35%, with a 38% increase in units sold versus year-ago sales.
- Classics like vanilla, chocolate and Neapolitan top the favorite pail flavors.
Advertisement - article continues below
Advertisement